
Tradovate Charts Load With Empty Gaps on Login
You log in, open your ES or NQ chart, and half of it is blank. Here's why Tradovate leaves empty gaps on the chart, and the moves that force the missing bars to load in seconds instead of an hour.
On This Page
- What Empty Chart Gaps in Tradovate Actually Mean
- Top Causes of Tradovate Chart Gaps
- 1. History loads on demand, not all at once
- 2. New chart tabs default to a low minimum bar count
- 3. A congested data feed right after login
- 4. Delayed or missing market-data subscription
- 5. Tick and volume charts hit a history limit
- How to Fix Empty Chart Gaps: Step-by-Step
- Fix 1: Scroll across the gap to pull the missing bars
- Fix 2: Restart or refresh to reload the whole feed
- Fix 3: Raise the “Minimum Bars to Load” setting
- Fix 4: Save a base chart template so new tabs keep the setting
- Fix 5: Confirm your market-data subscription is live
- Troubleshooting Table
- Where PickMyTrade Fits
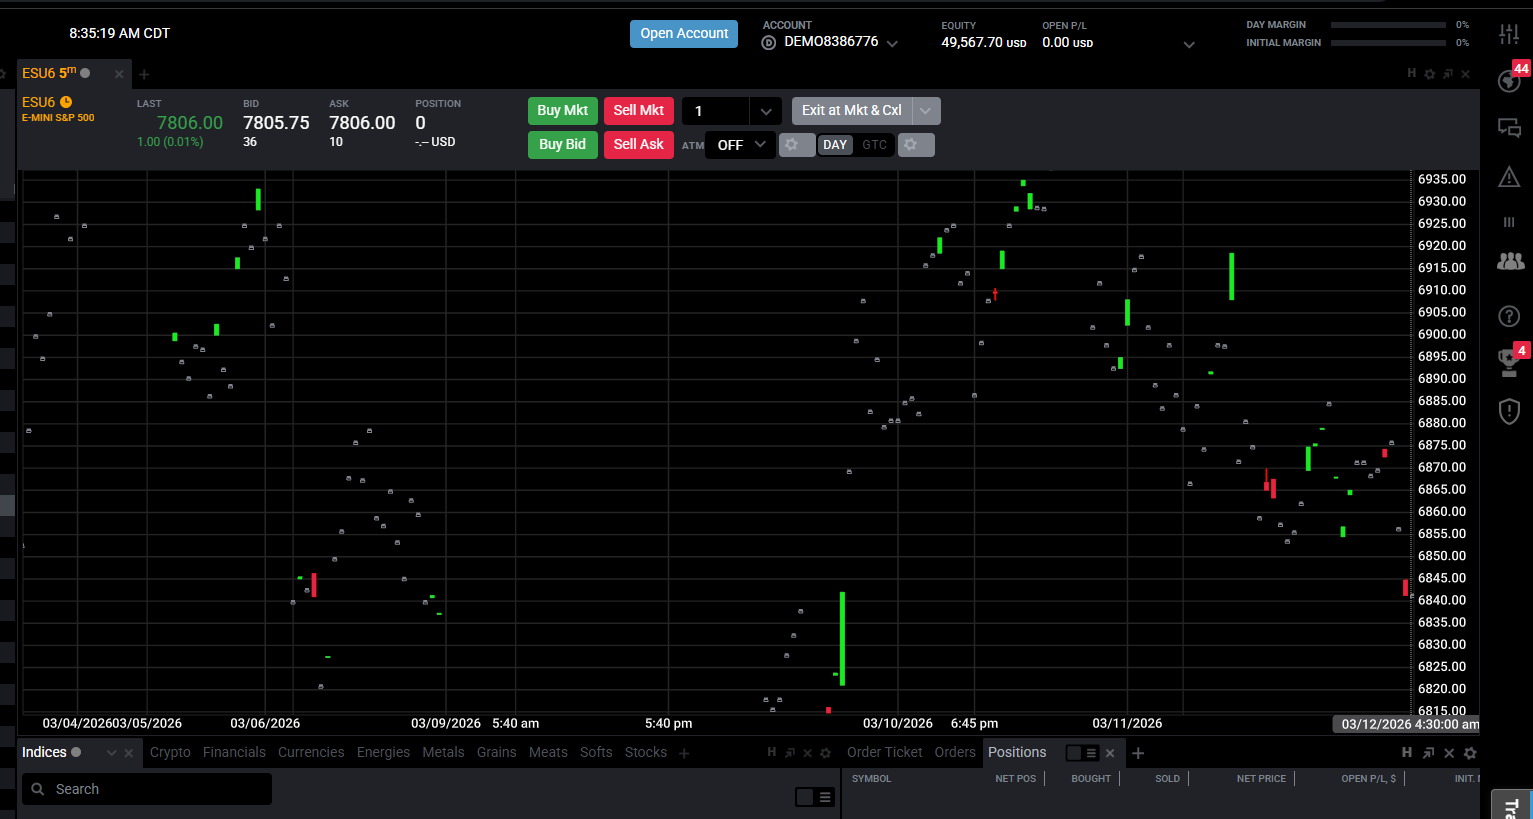
You log in to Tradovate, open your ES or NQ chart, and half of it is blank, clean stretches of white where candles should be. It's one of the platform's most common display bugs, and it usually looks worse than it is. Those gaps can sit empty for close to an hour before the bars finally stream in on their own. You don't have to wait that long. Tradovate still loads history on demand rather than all at once, so a few deliberate moves force the missing data to fill in within seconds.
The symptom shows up in a few variants: an empty gap in the middle of an otherwise-loaded chart, a chart that's slow or blank for the first minute after login, missing bars when you scroll back in time, or indicators like the 50 EMA and VWAP that visibly jump as older bars finally arrive. They all trace back to the same root cause, bars that weren't requested yet, and they're all fixable from the chart itself.
If you automate your entries, this bug matters less than it looks. PickMyTrade routes orders from your TradingView alerts straight to Tradovate, so a chart that's still painting candles never blocks or delays an automated fill. But when you're reading price by hand, an empty gap can hide the exact structure you're trading, so let's clear it.
Quick Checklist for Empty Chart Gaps
- Scroll left across the gap, dragging the chart into the empty range forces Tradovate to request the missing bars.
- Restart or refresh, close and reopen the desktop app, or refresh the browser tab on Tradovate Web, to reload the full data feed.
- Raise “Minimum Bars to Load”, bump the value in the chart's settings so more history preloads the moment the chart opens.
- Save a base template, new chart tabs reset to a low default bar count, so a saved template keeps your preferred setting.
- Confirm live market data, a delayed or missing subscription (orange symbol name) paints sparse or empty bars.
- Trim the load, fewer open tabs and indicators mean the startup data pull finishes faster.
What Empty Chart Gaps in Tradovate Actually Mean
An empty gap isn't corrupted data or a lost position, it's simply a range of bars Tradovate hasn't fetched yet. The charting engine loads only the candles it needs to fill the visible window, then requests more as you scroll or zoom. When the data server is busy (a login rush at the cash open is the classic trigger), those follow-up requests queue up, and the chart shows blank space until they return.
That's why the gap often heals itself if you leave it alone, the request eventually completes, sometimes an hour later. The fixes below just force that request to fire now instead of whenever the queue clears.
The related complaint, indicators recalculating and shifting when you scroll back, is the same problem wearing a different hat. Charts draw their indicators from whatever bars are currently loaded, so a moving average calculated on 100 preloaded bars looks different once 2,000 bars arrive. Load enough history up front and the jumping stops.
Top Causes of Tradovate Chart Gaps
1. History loads on demand, not all at once
Tradovate requests bars for the visible window and fetches more only when you scroll or zoom out. Jump straight to a zoomed-out or far-back view and you'll see empty space until the fetch completes.
2. New chart tabs default to a low minimum bar count
Every fresh chart tab opens with only a small number of bars preloaded. Add an indicator with a long lookback, or scroll back immediately, and you outrun the loaded data, which produces gaps and recalculating indicators.
3. A congested data feed right after login
At the open, everyone's platform is requesting data at once. Charts that load fine mid-session can crawl or stall during that burst, leaving temporary gaps until the feed catches up.
4. Delayed or missing market-data subscription
If your symbol name shows in orange, you're on delayed or no live data. A feed that isn't streaming can't paint current bars, which reads as sparse candles or a stalled right edge.
5. Tick and volume charts hit a history limit
Tick, volume, and range charts pull only a limited window of history by default, roughly two weeks, with an optional add-on entitlement for extended tick data (up to a year). Scroll past that window and the chart simply stops loading. Entitlements and limits change over time, so check what your account currently covers.
How to Fix Empty Chart Gaps: Step-by-Step
Fix 1: Scroll across the gap to pull the missing bars
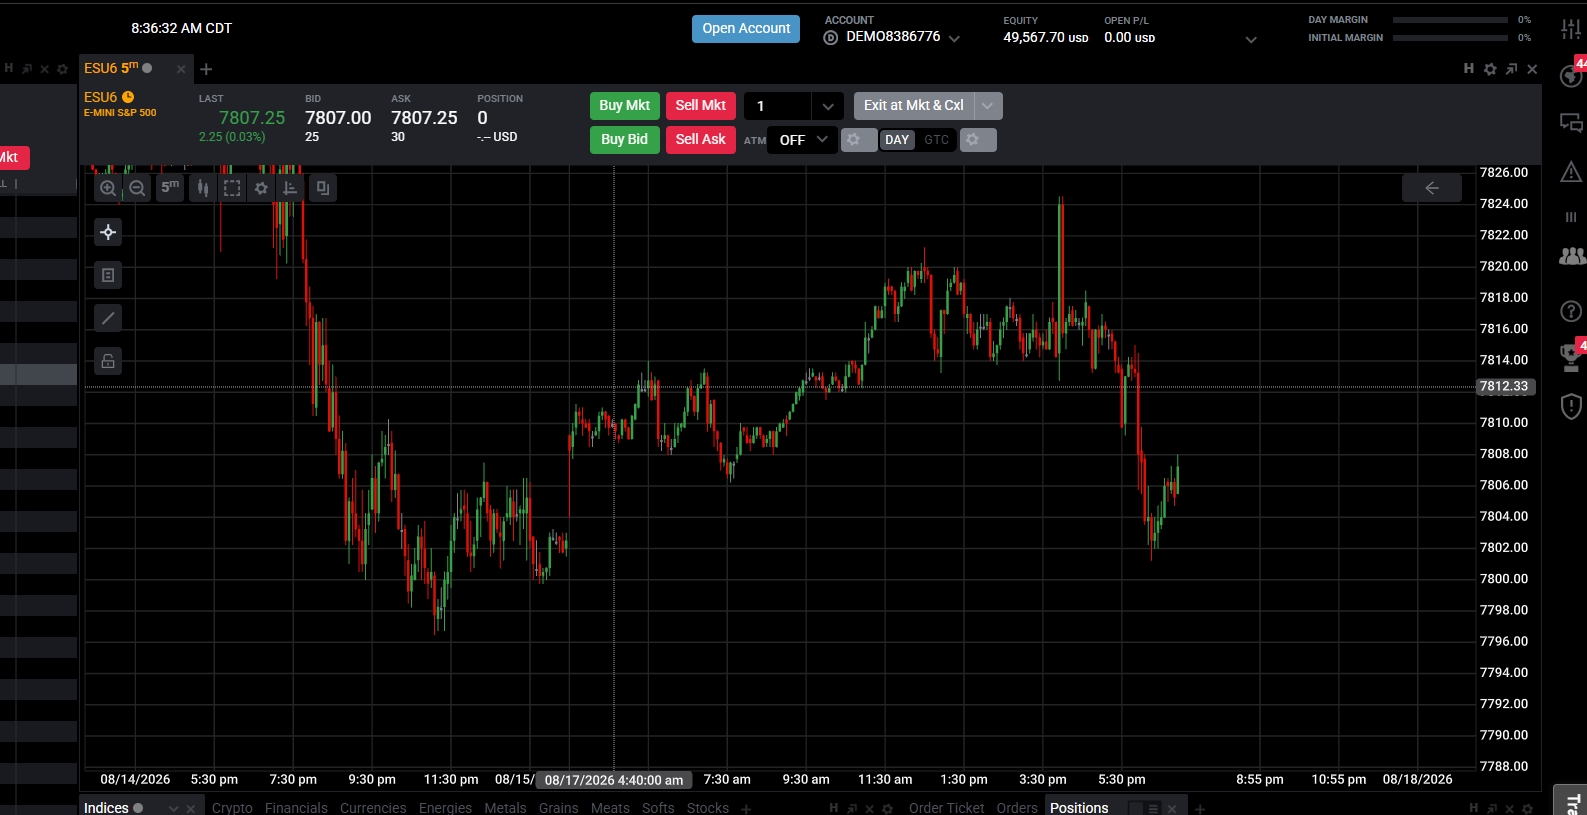
Click and drag the chart to the left, moving your view into the empty range. This is the fastest fix, and it works because Tradovate's loading is built exactly this way, dragging into unloaded territory triggers a fresh request for those bars, and they fill in within a second or two on a healthy feed.
Fix 2: Restart or refresh to reload the whole feed
If scrolling doesn't clear it, reload the data connection:
Tradovate Web
Refresh the browser tab (F5 / Ctrl+R) to reconnect and re-request the chart data.
Desktop app
Close and reopen the application, then sign back in.
Mobile
Force-close and relaunch the app.
There's no dedicated one-click “refresh chart only” button. The reliable way to force a full reload is a restart or browser refresh, which re-establishes the data feed from scratch.
Fix 3: Raise the “Minimum Bars to Load” setting
Preload more history so gaps never appear on open in the first place:
Open the chart settings
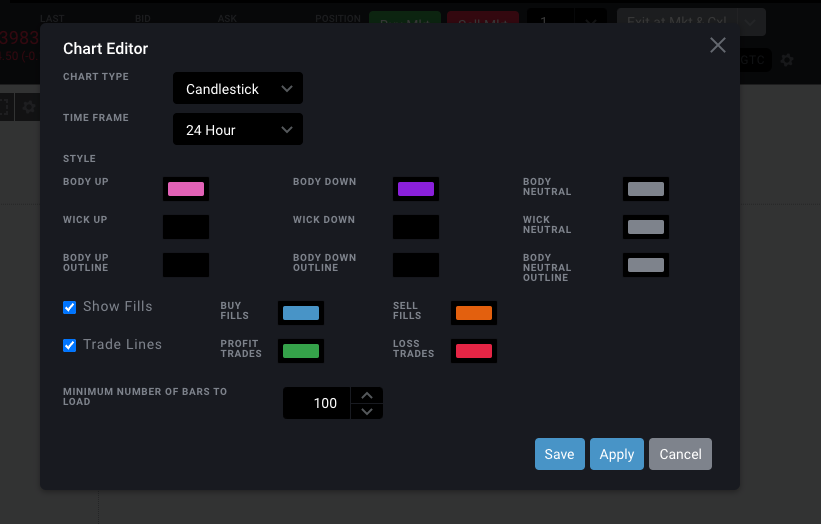
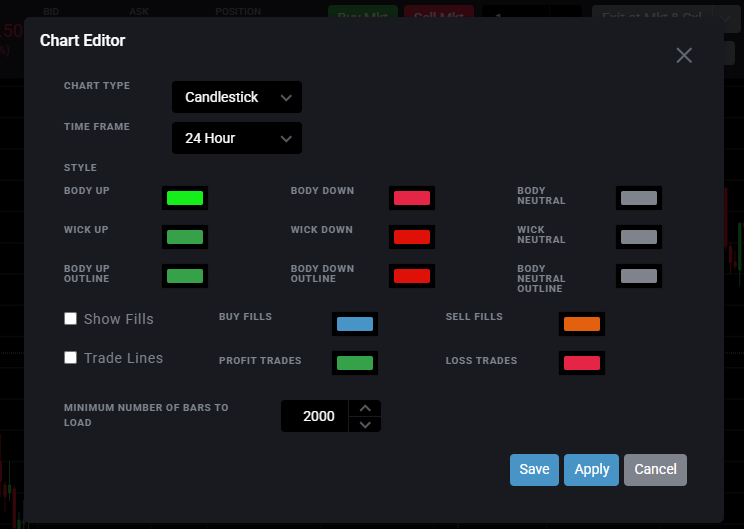
Open the chart's settings (the chart editor / settings panel).
Find Minimum Bars to Load
Find the Minimum Bars to Load field. Some builds label it “Minimum Number of Bars to Load,” but it's the same setting.
Raise the value
Raise it well above the default. The field accepts several thousand bars, so set it high enough to cover your longest indicator lookback plus room to scroll.
Fix 4: Save a base chart template so new tabs keep the setting
New chart tabs reset to the low default minimum, which undoes Fix 3 every time you open a chart. Lock it in with a template:
Configure your preferred chart
Configure one chart with your preferred Minimum Bars to Load, interval, and layout.
Save it as a template
Save it as a template (for example, “base 2000 bars”).
Apply it to new charts first
Apply that template when you open new charts, then add your indicators.
Fix 5: Confirm your market-data subscription is live
If the symbol name is orange or bars look stale, your feed is delayed or off. Enable or subscribe to real-time market data (data entitlements vary by account type and prop firm, so check your firm's current rules), then sign out and back in so the live feed attaches. For the full walkthrough, see our guide on Tradovate 10-Minute Delayed Data & Orange Symbols.
Troubleshooting Table
| Symptom | Meaning | Fix |
|---|---|---|
| Empty gap in the middle of the chart | Bars in that range weren't requested yet | Scroll left across the gap to trigger a fetch |
| Chart slow or blank right after login | Data feed still catching up on the startup burst | Wait a beat, then refresh (web) or restart (desktop) |
| Bars won't load when scrolling far back | Zoomed past the preloaded / tick-history window | Raise Minimum Bars to Load; check tick-data add-on |
| Indicators (EMA/VWAP) jump as you scroll | Not enough history was preloaded to calculate them | Raise Minimum Bars to Load and save as a template |
| New tab loads far fewer bars than expected | Tabs reset to the low default minimum | Apply your saved base template before adding indicators |
| Orange symbol name, sparse or stalled bars | Delayed or missing real-time market data | Subscribe to / enable live data, then re-login |
Where PickMyTrade Fits
Empty chart gaps are a display problem, but they become a trading problem when a stalled chart hides your entry or you second-guess a fill you can't see plotted. PickMyTrade takes the chart out of the critical path for execution:
- Alert-driven execution, orders fire from your TradingView alerts, not from Tradovate's chart render, so a lagging or gappy chart never delays a fill.
- Qty / symbol validation, every order is checked against the active contract and your size caps before it's sent, so a mis-read chart doesn't turn into a bad order.
- Rate-limit-safe routing, order flow is spaced out so nothing bounces during the same login-rush congestion that stalls your charts.
- Multi-account sync, the correct order mirrors across every linked account at once, with no manual re-entry while you wait for candles to paint.
Automate Your Tradovate Execution
Stop waiting on the chart to confirm a fill. Let PickMyTrade route your TradingView alerts straight to Tradovate, gaps or no gaps.
Start Your Free 7-Day TrialFrequently Asked Questions
Tradovate loads chart history on demand, it fetches only the bars needed for the visible window, then requests more as you scroll. When the data server is busy (typically right after login), those requests queue and the chart shows blank space until they return.
Drag the chart left into the empty range to trigger an immediate request for the missing bars. If that doesn't clear it, refresh the browser tab on Tradovate Web or restart the desktop app to reload the entire data feed.
There's no dedicated one-click "refresh this chart" control. The reliable ways to force a full reload are scrolling across the gap, refreshing the browser on Tradovate Web, or restarting the app on desktop and mobile.
Indicators are calculated on the bars currently loaded. If only a small number of bars preloaded, a moving average or VWAP recalculates and shifts as more history arrives. Raising the Minimum Bars to Load setting so enough history loads up front stops the jumping.
The Minimum Bars to Load field accepts several thousand bars, and you can set it high enough to cover long indicator lookbacks. Exact caps change between builds, so confirm the current maximum in your chart settings.
New tabs default back to a low minimum bar count regardless of your previous setting. Configure one chart the way you like it, save it as a template, and apply that template to new tabs to keep the higher count.
Not quite. Tick, volume, and range charts pull only a limited history window by default, with an optional add-on for extended tick data. For deep history, use a time-based interval or check your current data entitlements.
No. Gaps are purely a chart-display issue, your positions, orders, and fills are unaffected. If you automate through PickMyTrade, execution runs off your alerts, so a gappy chart never touches your order flow.
This guide is for educational and informational purposes only and is not financial, investment, or trading advice. Trading futures and other leveraged products carries a substantial risk of loss and is not suitable for every investor. PickMyTrade is an independent third-party automation platform and is not affiliated with, endorsed by, or sponsored by Tradovate, Inc. "Tradovate" and all related names, logos, and trademarks are the property of their respective owners. Platform features and steps change over time, so always confirm the current process in the official Tradovate platform and documentation before acting.